We compared three applications for HVAC load calculations for a comparison of the overall results, usability and time required to obtain the results, and overall features available.
The three applications reviewed were:
We’ve summarized the results of this study below so potential users can get a sense of what it’s like to use each software package over and make a comparison a variety of categories.
One important note to start off is about the structure of the inputs. Chvac and HeatWise were structured similarly in the sense that spaces are built by defining space attributes, envelope, internal loads, and other miscellaneous information, whereas HAP was structured very differently. It is also worth noting that HAP version 5 is structured very similarly to how HeatWise and Chvac are structured, but version 6 had some major changes. In HAP V6, space types are created and then applied to spaces that are built in the floor plan. The floor plans must be defined for the entire building by drawing out walls and partitions, placing windows, and assigning rooms to zones. The these rooms can have space types applied to them.
Below are important features of each application:
Reading through the outputs was a very different experience for each application. Chvac and HAP both provided more detailed results, and gave more flexibility in terms of what was reported. HeatWise provided less detail, but in a much simpler format that was easier to understand. HAP and Chvac gave PDF exports, whereas HeatWise provided results on the browser that could be accessed at any time, as well as a Microsoft Excel export.
The results varied between the three applications. The highest cooling loads were seen in Chvac and the lowest were seen in HeatWise. However, between the three of them Chvac was the outlier, with HAP and HeatWise providing fairly similar results.
The project studied was an existing 7-storey office building located in Vancouver, BC, Canada. The climate is mild in the winter with mild but humid summers. The building was built in 1970, made mostly of heavy concrete. Only one floor was modelled for this example, with one VAV air handling unit serving the entire floor. The floor was approximately 4500 ft2 with open office area, closed offices, boardrooms, and a lunch room.
Below is a summary of the total loads calculated from each application:
Table 1: Peak Loads by Application
| Application | Heating Load (MBH) | Sensible Cooling (MBH) | Latent Cooling (MBH) | Peak Airflow (CFM) |
|---|---|---|---|---|
| HAP | 31.61 | 78.9 | 29.2 | 4027 |
| HeatWise | 45.7 | 83.8 | 22.1 | 3579 |
| Chvac | 85.9 | 110.3 | 27.7 | 4933 |
1. The heat load was not provided for the whole system, but was only provided on a by-zone basis, therefore this result was calculated by adding up all heating loads. It was unclear if this would be the final actual heating load based on adjusted airflow values and whether or not it was including ventilation.
One noteworthy comparison between the three applications is the airflow and the latent cooling load. The tables below compares the time of the peak cooling, peak total cooling load, and peak airflow as reported by each application. For spaces that were internal, only a time of day was reported (without the month) because the time of year makes no difference for internal zones.
Table 2: Time of Peak Sensible Cooling Load by Zone
| Space | HeatWise | HAP | Chvac |
|---|---|---|---|
| Reception | 6pm June | 5pm June | 6am June |
| East Cubicles | 9am July | 9am July | 9pm June |
| West Cubicles | 4pm July | 4pm June | 4pm June |
| Corridor | 4pm | 4pm | 7pm |
| Lunch Room | 11am August | 10am March | 10am September |
| South Cubicles | 10am September | 10am March | 10am September |
| South Offices | 3pm September | 2pm March | 3pm September |
| Large Boardroom | 4pm August | 4pm July | 4pm August |
Table 3: Peak Sensible Cooling Load by Zone (MBH)
| Space | HeatWise | HAP | Chvac |
|---|---|---|---|
| Reception | 10.3 | 10.8 | 11.6 |
| East Cubicles | 12.8 | 13.4 | 18.1 |
| West Cubicles | 12.2 | 12.5 | 16.5 |
| Corridor | 2.3 | 3.2 | 2.9 |
| Lunch Room | 19.7 | 30.8 | 24.3 |
| South Cubicles | 11.3 | 12.4 | 14.3 |
| South Offices | 14.4 | 15.0 | 17.0 |
| Large Boardroom | 14.3 | 15.2 | 16.4 |
Table 4: Peak Airflow by Zone (CFM)
| Space | HeatWise | HAP | Chvac |
|---|---|---|---|
| Reception | 471 | 502 | 542 |
| East Cubicles | 584 | 619 | 842 |
| West Cubicles | 561 | 579 | 768 |
| Corridor | 105 | 146 | 64 |
| Lunch Room | 901 | 1426 | 1133 |
| South Cubicles | 518 | 573 | 667 |
| South Offices | 657 | 694 | 792 |
| Large Boardroom | 654 | 706 | 764 |
The summary of peak sensible loads is shown in the image below:
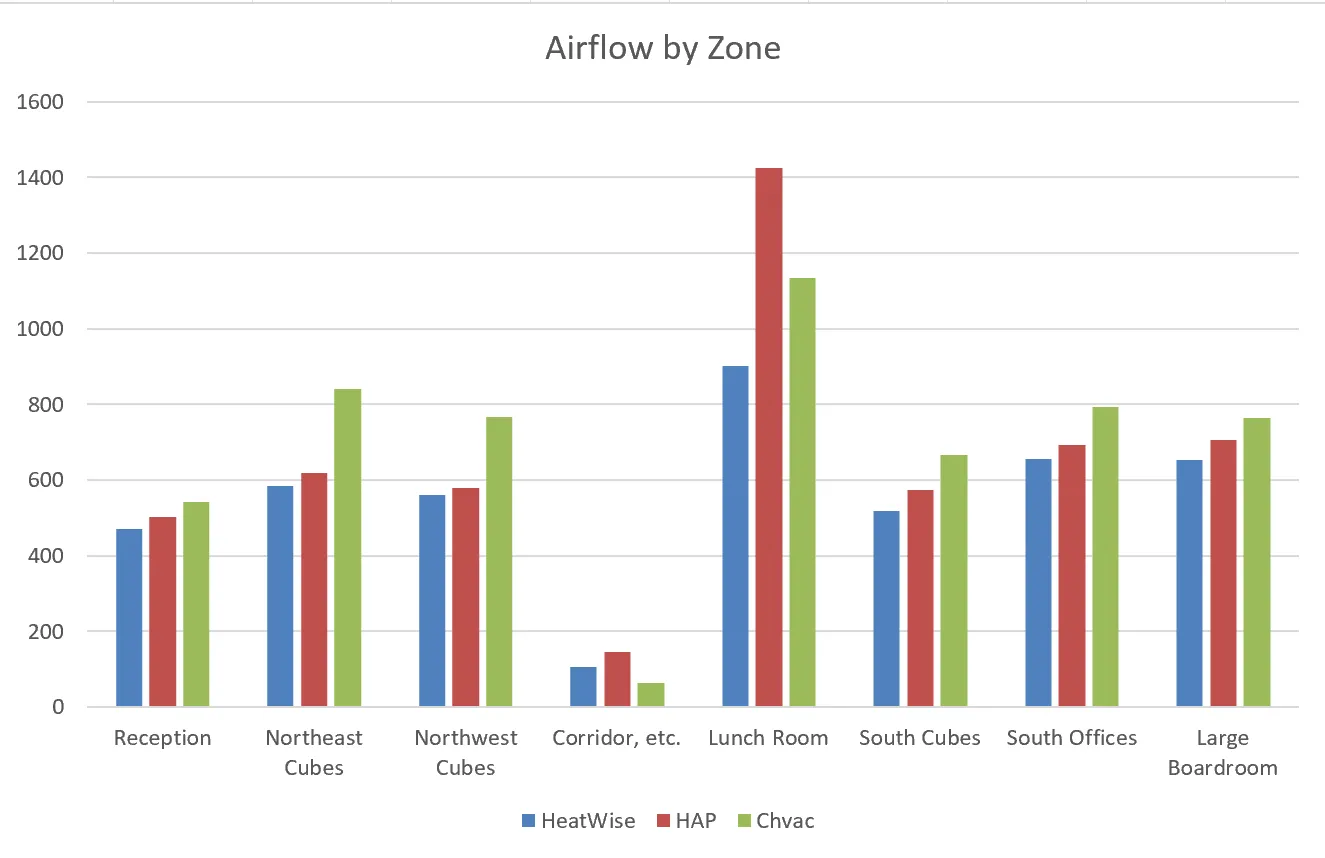
Clearly there is a trend with Chvac estimating the highest loads, followed by HAP and then HeatWise, with the exception of the Lunch Room as an outlier where HAP estimated a much larger cooling load. There is generally more agreement between HeatWise and HAP. HAP is considered to be industry standard and most engineers have trust in its accuracy. Using HAP as a baseline, these results would suggest that both HeatWise and Chvac should be considered trustworthy as well.
HeatWise had a lower sensible load per zone than HAP, and therefore less airflow per zone and less airflow overall. Yet HeatWise had a higher sensible coil load than HAP, which seems counterintuitive. One explanation is that the simulation in HeatWise estimated 15% of wall loads as going into the ceiling plenum, as well as some portion of the lighting (see a description of why that may happen here: Plenum Load Impacts). This means that the spaces saw less total heat gain, and therefore required less air, resulting in a much lower airflow value. However, that heat still enters the system, but instead is manifested as a higher return air temperature, which is why the total sensible load is actually higher in HeatWise versus HAP.
The lower airflow also explains the discrepancy in coil latent loads, since the zones were assumed to be at 50% relative humidity regardless of how much air was moving through them, so a lower airflow means less moisture being pulled out of the air.
Overall, HeatWise was much easier to use than the other applications, and load outputs were easier to analyse. Inputs such as building walls and windows seemed to correlate to similar wall R-values and Window U-values between all three apps. One major defect of Chvac was that SHGC values had to be entered manually for each different solar angle, whereas HeatWise and HAP only require one input and then generate the remainder of the values for varying angles.
For a detailed description of different calculation methods, see our blog post on comparing HVAC load calculation methods. For a detailed breakdown of how HeatWise works, see our blog post: How HeatWise Works.