This post assumes you already have some basic knowledge of psychrometrics, and will focus on the various psychrometric processes. If you’re new to psychrometrics, check out Part 1 of this series to get caught up.
Technically psychrometric processes could be split into 5 categories, but we will only focus on 4 here. The 4 that will be looked at are:
Technically cooling and dehumidification can be split into two separate processes, but typically dehumidification does not happen without cooling, and cooling can only happen up to a certain point before dehumidification is inevitable, so it is better to treat them as one process.
Recall that air at some state can be plotted on a psychrometric chart, and this state gives us all the information we need about the air. Let’s take a deeper dive into each one of these processes and how they look on a psychrometric chart.
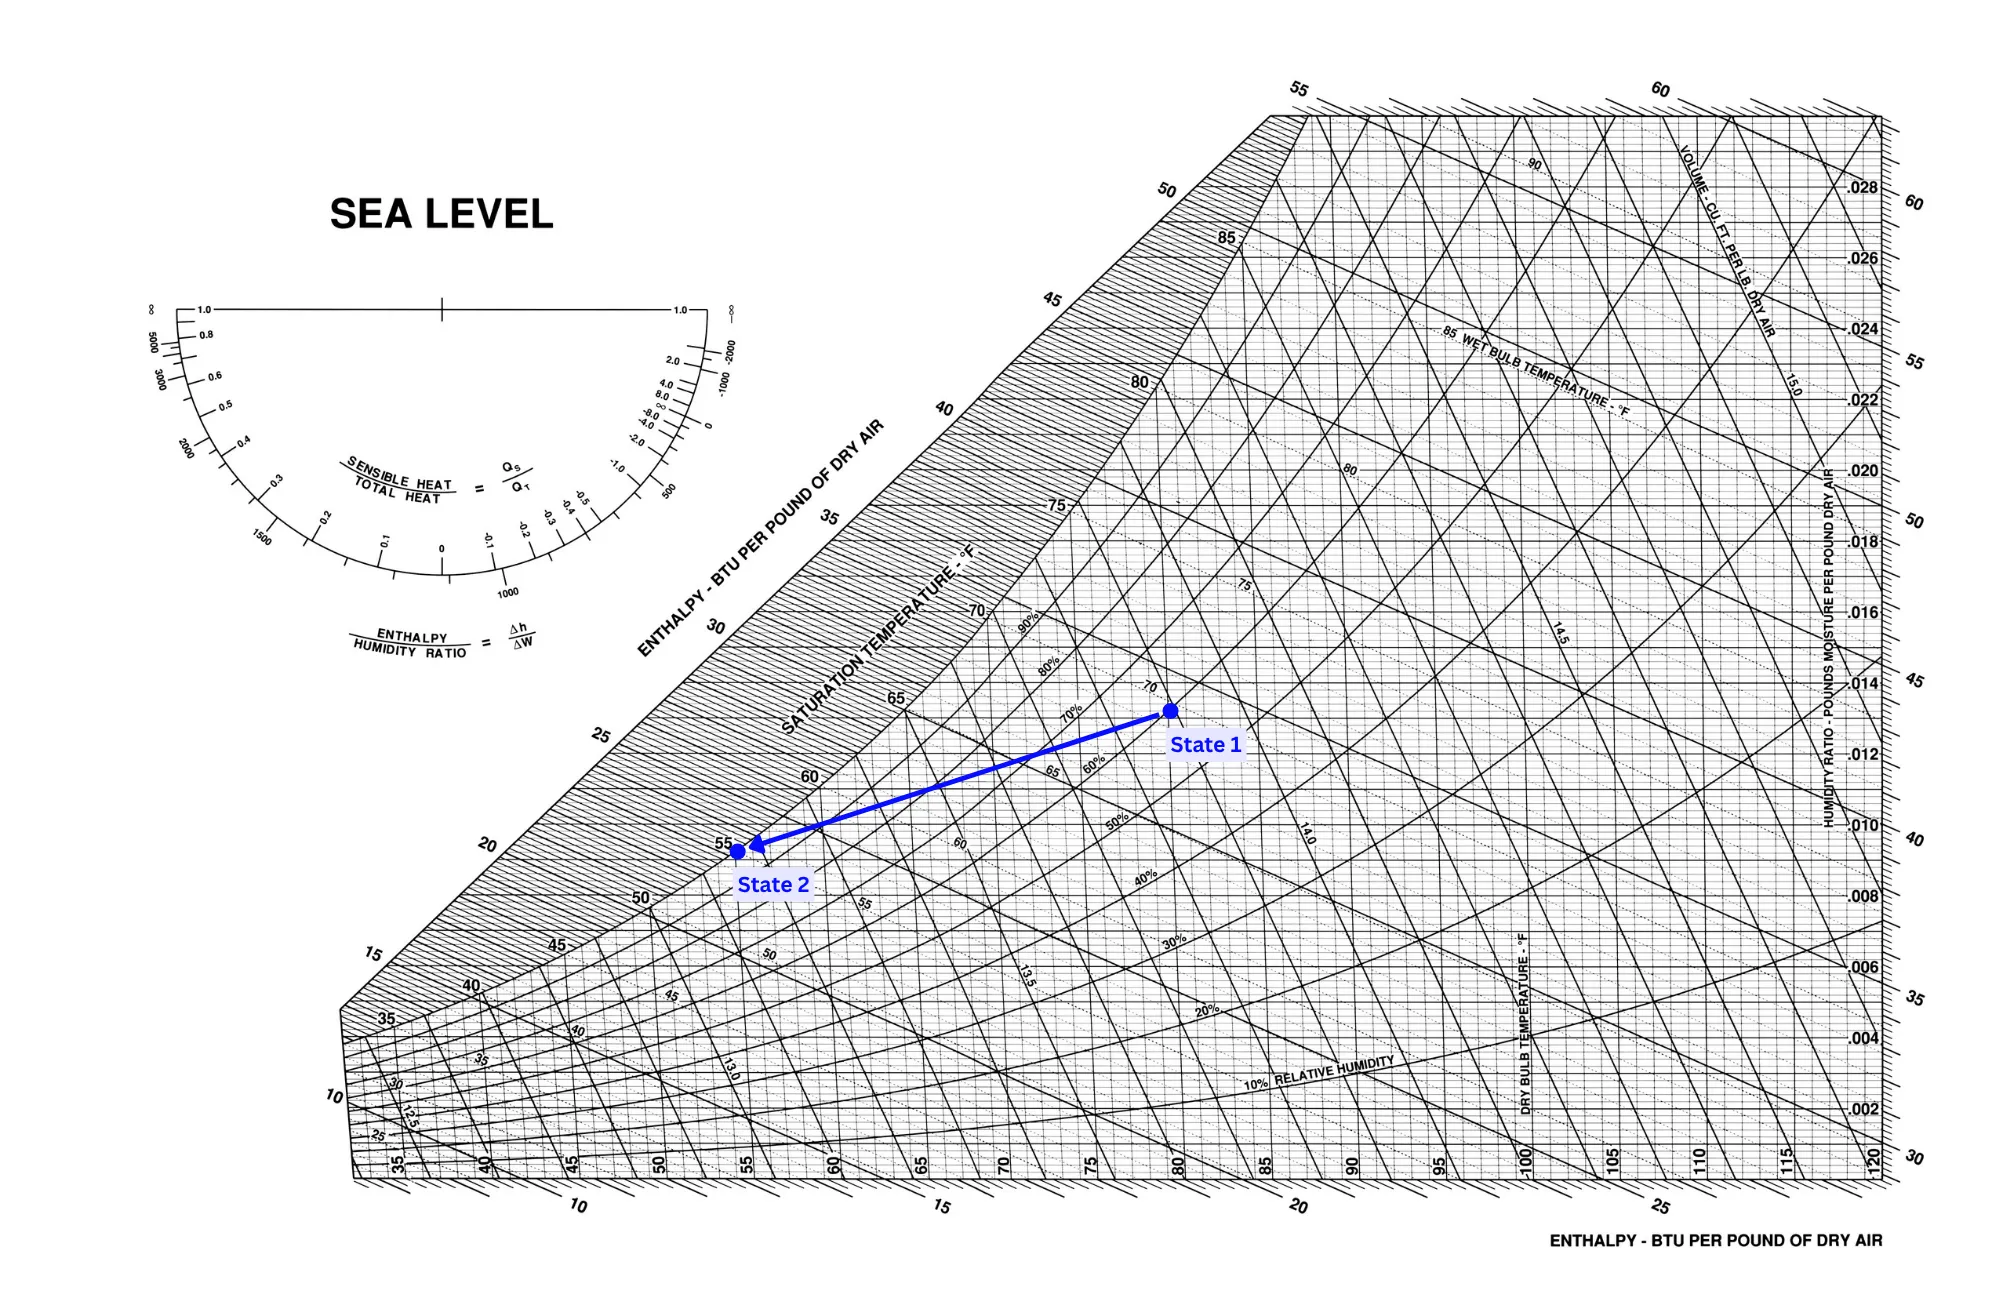
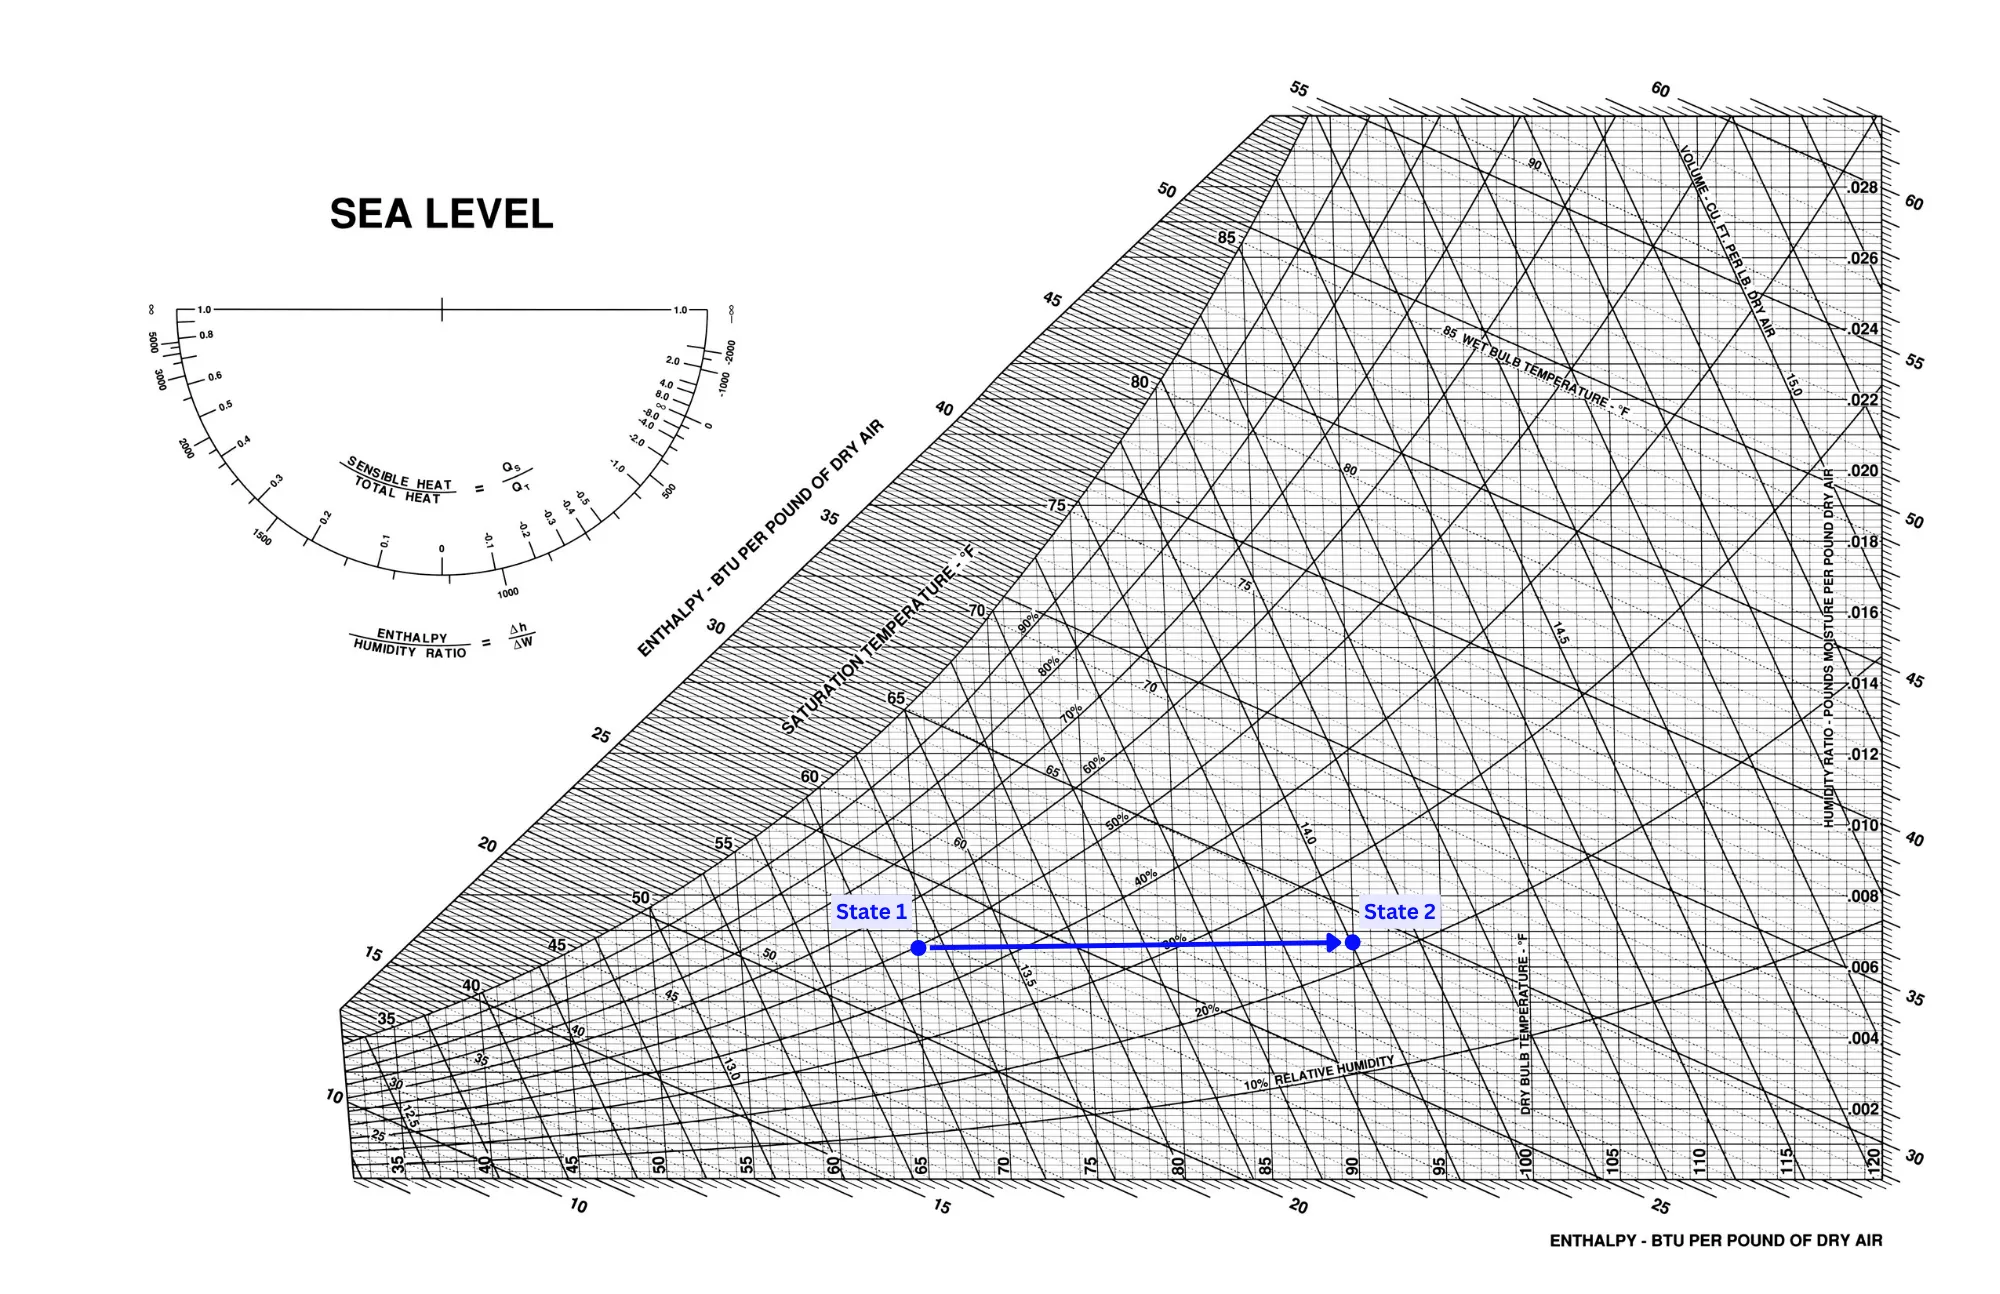
Cooling is possibly the most important process to understand due to the dual nature of latent and sensible cooling, and how the coil temperature, air velocity, water flow (or refrigerant flow for DX coils) affects the nature of the cooling process. Cooling is shown as a line moving from right to left on a psychrometric chart, and dehumidification is shown as a movement from high to low, as shown in the images below.


The left image depicts a sensible cooling process (no dehumidification) and the right image depicts latent cooling (dehumidification only). The to compute total cooling, the enthalpy at each state must be known. The table below shows the relevant values for each case.
| Process | Value | State 1 | State 2 |
|---|---|---|---|
| Sensible cooling | Dry bulb temperature Relative humidity Enthalpy | 85oF 30% 28.8 Btu/lb | 65oF 59% 24.0 Btu/lb |
| Latent cooling | Dry bulb temperature Relative humidity Enthalpy | 87oF 60% 30.2 Btu/lb | 75oF 37% 25.4 Btu/lb |
Notice how in both cases the difference in enthalpy from state 1 to state 2 is 4.8 Btu/lb. Since net cooling effect is measured as a difference in enthalpy from start to finish, it means that these two processes have the same net cooling effect, even though in the second process the temperature never changed.
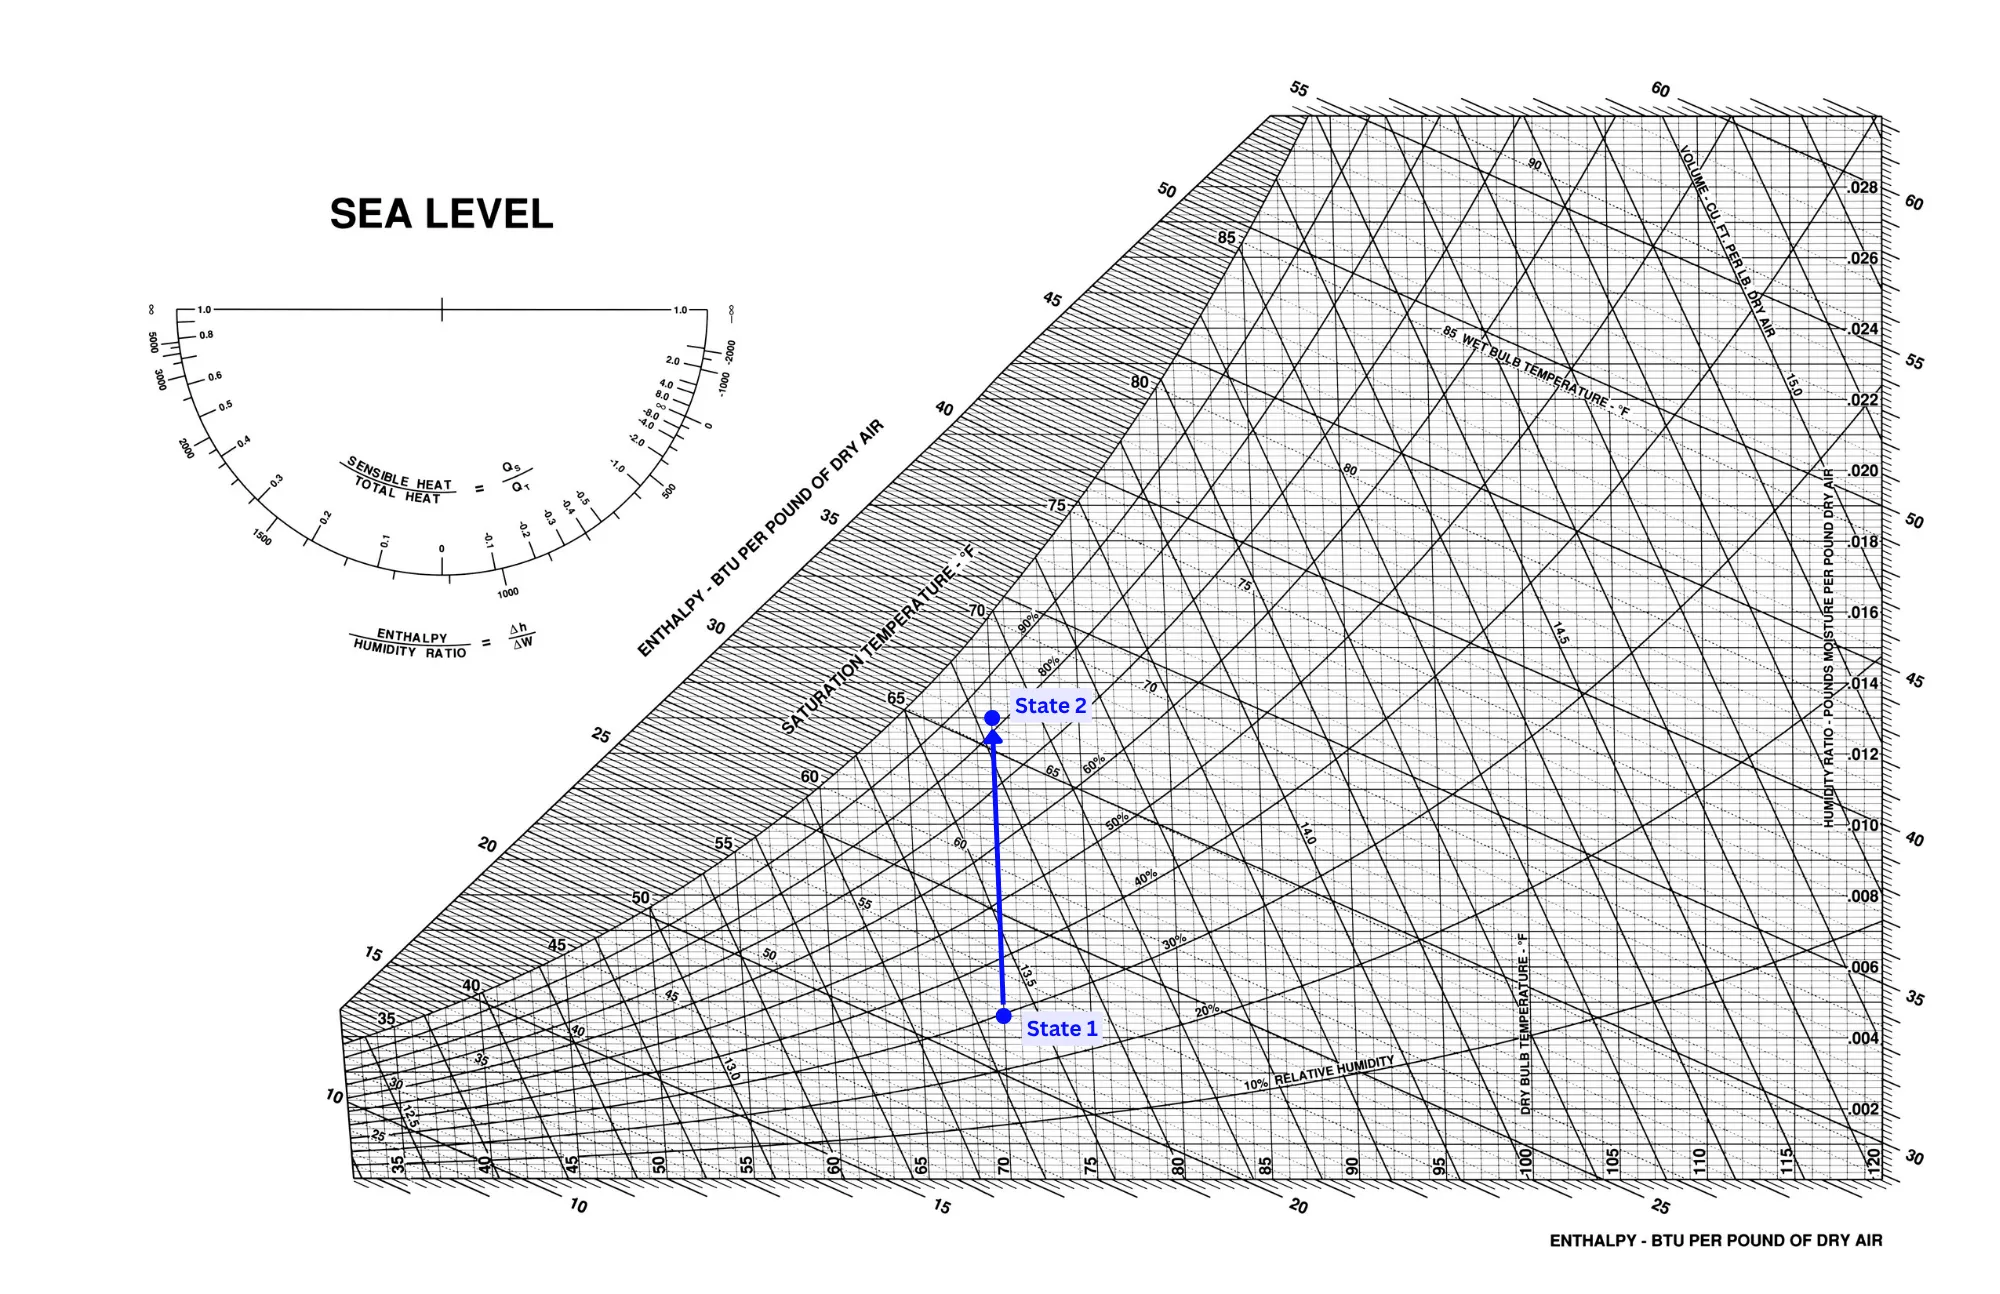
The image below shows a more realistic cooling process. This process has a continual change in both temperature and humidity as the air moves across the coil.
 This process shows the air coming to a final state of 55oF dry bulb temperature and 100% humidity (fully saturated). This is realistic because if the coil is kept at a temperature of approximately 55oF then water will start condensing on the coil almost immediately due to the fact that the dewpoint temperature in state 1 is at 65oF - well above the coil temperature. Since cooling is achieved by blowing air over a chilled coil, and that coil will almost always be at a temperature below the dewpoint of the air, dehumidification is expected to occur simultaneously with a change in temperature.
In this example, the enthalpy changes from 33.6 Btu/lb to 23.2 Btu/lb. To determine the net sensible and latent portions of this total cooling involves further discussion, which will be presented in the next blog post of this series.
Heating is typically done as a sensible-only process, meaning it is just a horizontal movement on a psychrometric chart. A heating process looks like the reverse of a sensible cooling process, as shown in the image below.
 This makes heating a very easy process to understand, and therefore results in far less math and analysis than a cooling process.
Humidification is the reverse of a purely latent cooling process, and is shown as a vertical movement on a psychrometric chart.
 A purely latent heating process is highly unlikely since water is normally heated to steam before being injected into the air. Because of this, it will add both latent and sensible heat to the air stream, resulting in a process such as in the picture below.

The mixing of two air streams is a very different process than the others because it takes two starting points and ends with one final state. Air stream mixing is typically assumed to be adiabatic, meaning that no heat is lost in the process. The final state of the air lies on the line connecting the to points of each air stream.
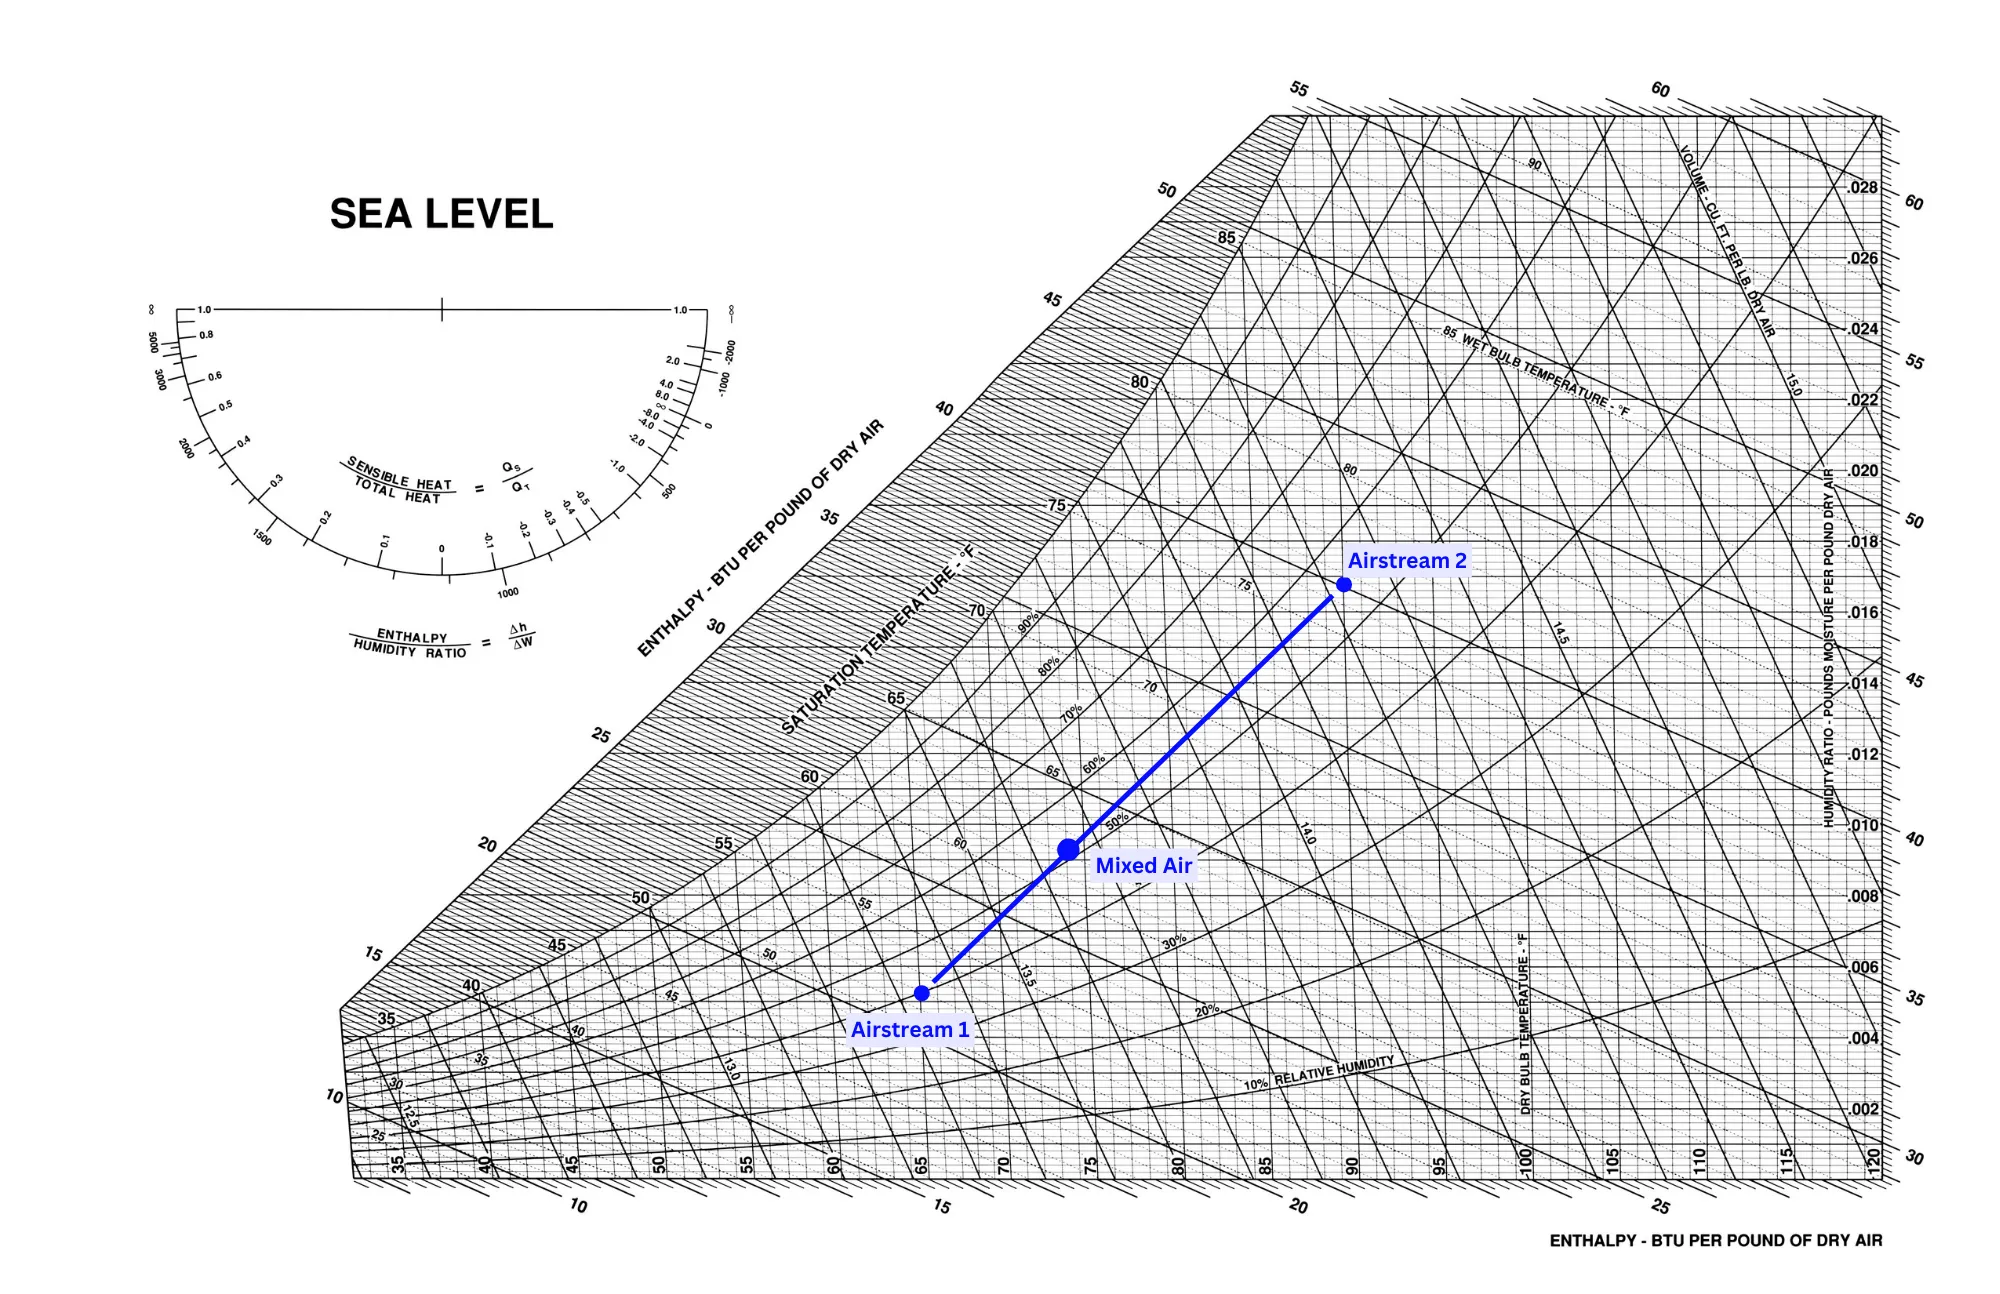 The picture above shows two air streams plotted on a psychrometric chart. The state of the mixed air lies on the line connecting the two points, the only question is to know where exactly on the line it will be placed. The location on that line is dependent on the proportional volume of each air stream being mixed. In the case above, the mixed state is closer to the Aistream 1 point, meaning that Airstream 1 has a higher flow.
The location of the point is found by treating the line as two separate segments - segment 1 is from Airstream 1 to the Mixed Air point and segment 2 is from Aistream 2 to the Mixed Air point. The ratio of these lengths should be equal to the inverse of the ratio of airflows of Airstream 1 to Airstream 2. For example, suppose Airstream 1 is 1000 cfm and Airstream 2 is 2000 cfm. The ratio of airflows is 1/2, therefore the ratio of line lengths of segment 1 to segment 2 should be 2/1=2. With this ratio of line segments, it means that the length of segment 1 is 1/3 of the total length and segment 2 is 2/3 of the total length. These ratios can be measured on the chart by simply using a ruler.
To be more accurate, the ratio of mass flow rates should be used rather that volumetric flow rates. Mass flow rates can be easily determined by dividing each volumetric flow rate by its respective specific volume, which can be found on the chart as well.
These are the four basic psychrometric processes presented in a graphical way. Many engineers think it may be easier to simply program these calculations into a spreadsheet, however the calculations are more complicated than most people would think, and the psychrometric chart can offer clear insight about when condensation may happen in a cooling process. For this reason many senior engineers still use psychrometric charts when sizing cooling coils and designing systems.
In the next part of this series I will cover the equations used to quantify the processes, which are used to complement the psychrometric chart rather than replace it.